Detecting influenza epidemics using search engine query data
Contents
Paper
- Title: Detecting influenza epidemics using search engine query data
- Authors: Jeremy Ginsberg, Matthew H. Mohebbi, Rajan S. Patel, Lynnette Brammer, Mark S. Smolinski & Larry Brilliant
- DOI: 10.1038/nature07634
- Tags:
- Year: 2009
Summary
What
- Propose a method of analyzing large numbers of Google search queries to track influenza-like illness in a population which can shorten reporting lag for 1-2 weeks.
Why analyze Google queries possible
- Innovative surveillance systems become available, e.g. telephone traige advice lines and over-the-counter drug sales.
- A large number of American adults (about 90 million) tend to search online for information about specific disease.
- Data of required queries can be accessed through several websites which collect such information.
- Correlation between a set of Yahoo search queries containing keywords about influenza-like illness and virological and mortality surveillance data were found.
How
- Obtain data
- Query fraction
- Create a time series of weekly counts for 50 million of the most common search queries of in the US from search queries logs between 2003 and 2008.
- The time series data was separately calculated for nine states.
- Query fraction was computed to remove the effect of totla numbers of queries.
- ILI data
- Publicly available historical data from the CDC’s US Influenza Sentinel Provider Surveillance Network.
- Only record data of weeks inside annual influenza seasons.
- Query fraction
Method
- Linear model
- $\mathit{logit}(I(t)) =\alpha \mathit{logit}(Q(t)) + \varepsilon$
- where $I(t)$ is the percentage of ILI physician visits, $Q(t)$ is the ILI-related query fraction at time $t$, $\alpha$ is the multiplicative coefficient, and $\varepsilon$ is the error term. $\mathit{logit}(p)$ is simply $\ln (p/(1 - p))$.
- Select ILI-relatied queries
- A list of highest scoring search queries
- Use one query at a time to measure the efficiency of fitting in each region.
- Reward query which shows regional variations similar to the regional ILI data.
- Obtain a list of highest scoring queries, sorted by mean Z-transformed correlation across nine regions.
- A set of search queries
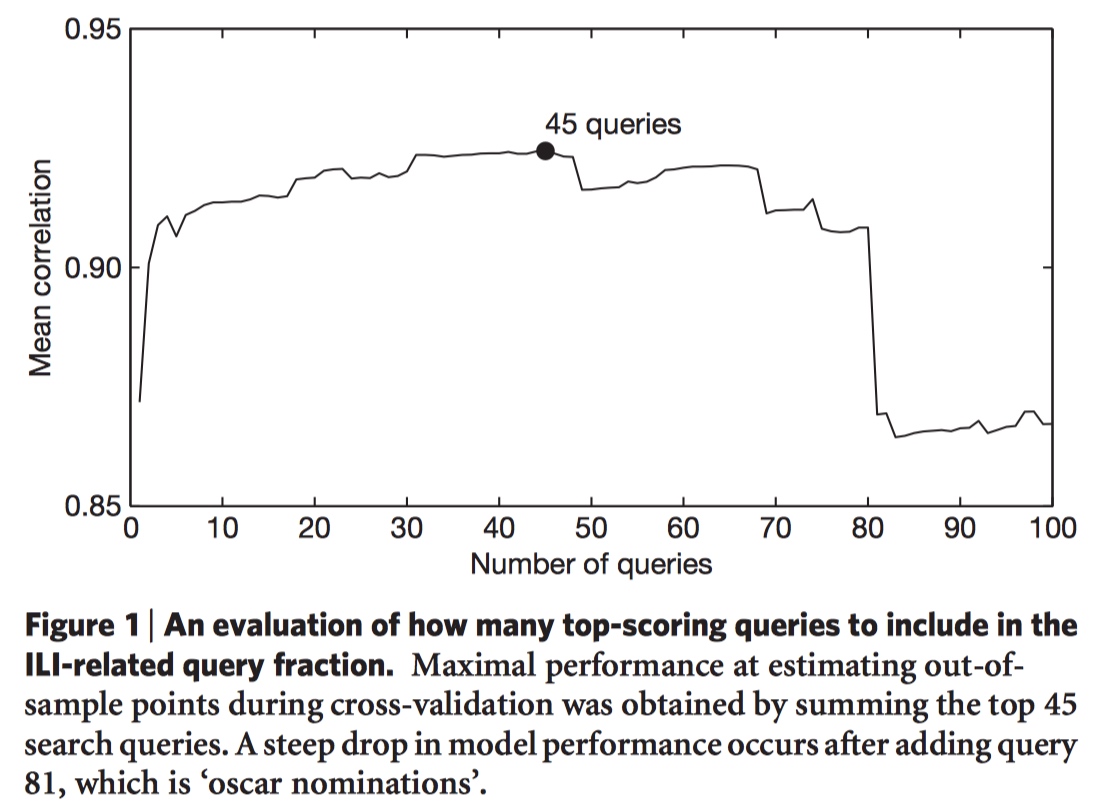
- Consider different sets of top $n$ queries in the list. $n=45$ was found to be the best result.

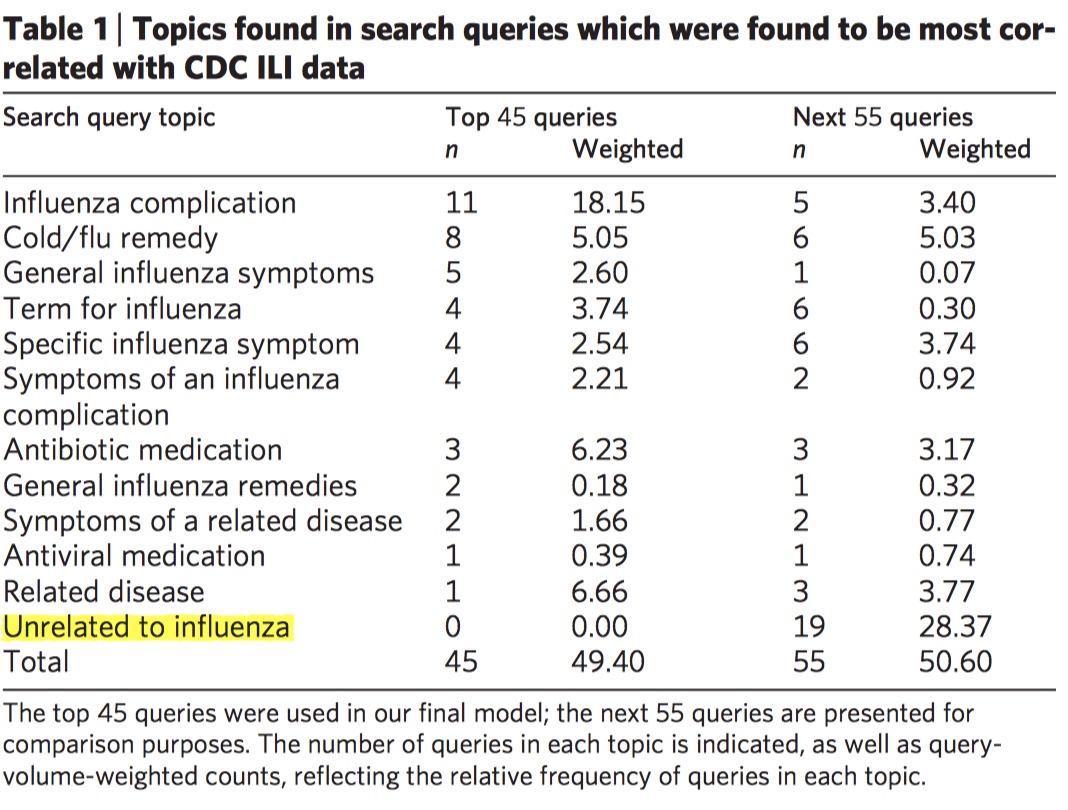
- The 45 queries appear to be consistently related to ILIs. Other 55 queries tend to coincide with influenza season in the US.

- Consider different sets of top $n$ queries in the list. $n=45$ was found to be the best result.
- A list of highest scoring search queries
- Linear model
Evaluation
- Correlation between $\mathit{logit}(I(t))$ and CDC-reported weekly ILI percentages.
- Obtain data
Results
- For nine region together
- Train set: A mean correlation of 0.90 (min=0.80, max=0.96, n=9 regions; Fig.2).

- Validation set: A mean correlation of 0.97 (min= 0.92, max = 0.99, n = 9 regions) across 42 validation points.
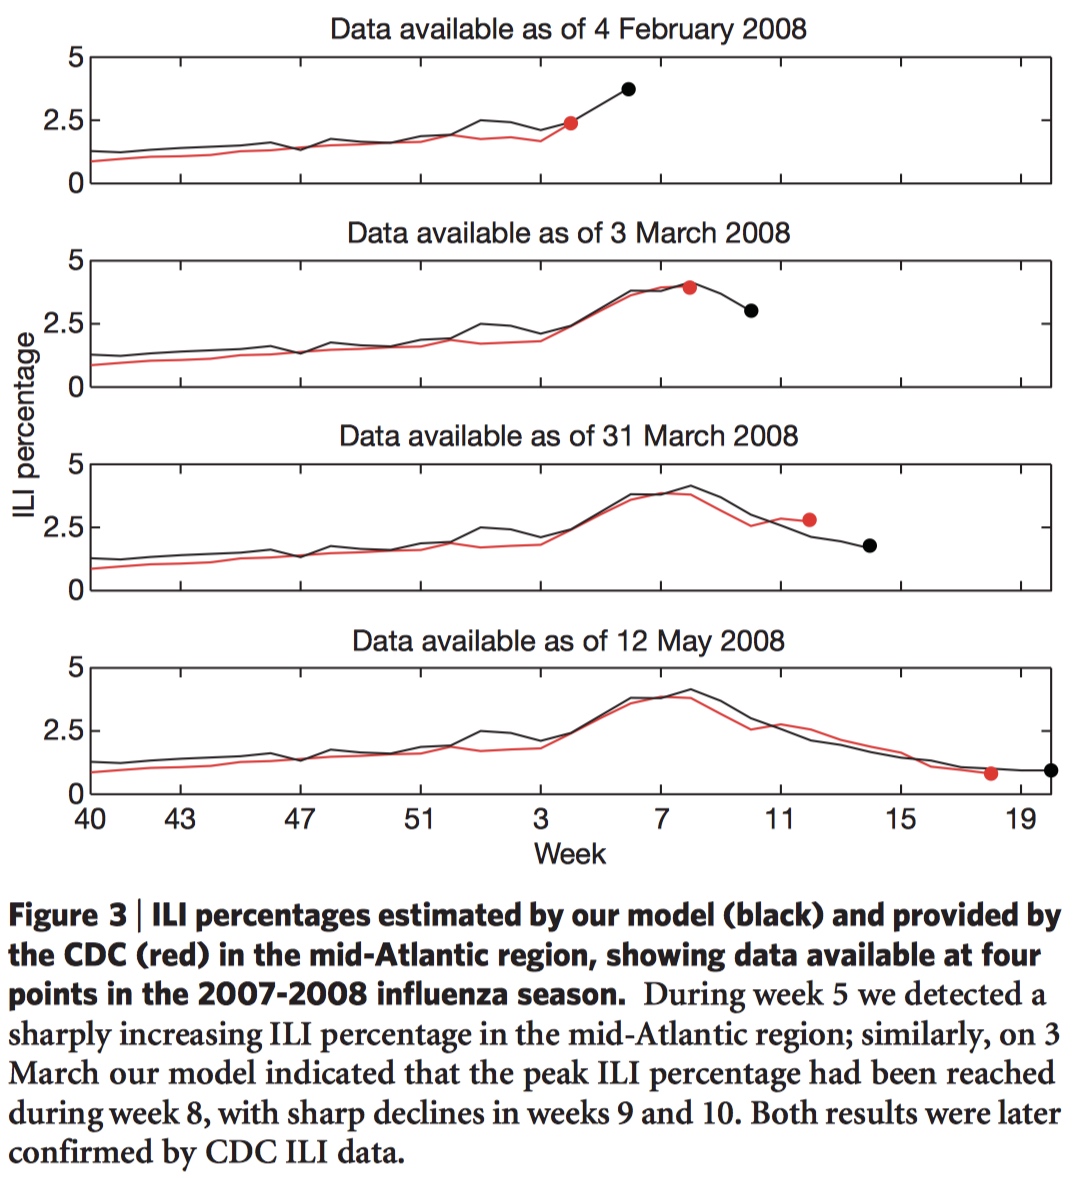
- Estimate consistently the current ILI percentage 1-2 weeks ahead of the publication of reports by the CDC’s US Influenza Sentinel Provider Surveillance.
- Train set: A mean correlation of 0.90 (min=0.80, max=0.96, n=9 regions; Fig.2).
For one state (Utah) only
- A correlation of 0.90 across 42 validation points.

- A correlation of 0.90 across 42 validation points.
Conclusions
- Pros
- Resulting ILI estimates were consistently 1-2 weeks ahead of CDC’s reports.
- Up-to-date report may enable public health officials and health professionals to respond better to seasonal epdemics.
- Cons
- Can’t replace traditional surveillance networks or supplant the need for laboratory-based diagnoses and surveillance.
- The correlations are only meaningful across large populations since the queries are not only submitted by users who are experiencing influenza-like symptoms.
- The system remains susceptible to false alerts caused by a sudden increase in ILI-related queries, such as drug recall event.
- Pros
- For nine region together
Author Octemull
LastMod 2019-01-18